How absence tracking affects productivity: a guide for HR leaders
Discover how effective absence tracking can boost productivity by identifying patterns and enabling proactive HR interventions.

Accurate absence tracking turns absence from a cost you react to into a signal you act on. When HR teams have real-time, centralised data, they can spot patterns early, plan cover before gaps appear, and intervene before a short-term health issue becomes a long-term drain on output. ONS data puts UK sickness absence at 148.8 million working days lost in 2022, averaging 5.7 days per employee. CIPD and HSE both frame this as a persistent operational risk, not a background noise problem.
Start here, today:
- Pull your last 12 months of absence data and calculate your average days lost per full-time equivalent (FTE).
- Identify your top three absence reasons and whether they cluster in particular teams or roles.
- Check whether your current system flags repeated short-term absence automatically, or whether a manager has to notice it manually.
- Book a return-to-work conversation template review with your line managers this month.
Key takeaways
Accurate absence tracking reduces hidden productivity loss by turning absence from a cost you react to into a signal you can act on before it compounds.
| Point | Details |
|---|---|
| Scale of the problem | ONS data shows 148.8 million working days lost annually in the UK, averaging 5.7 days per employee. |
| The absence multiplier | One absence disrupts cover, throughput, and manager time, making the true cost far higher than a daily salary figure. |
| Presenteeism blind spot | Tracking only recorded absence misses employees who attend while unwell; cross-reference absence and performance data to see the full picture. |
| Metrics to prioritise | Days lost per FTE is the single most useful starting benchmark; add Bradford Factor scores to catch pattern absence early. |
| Timeprof in practice | Timeprof centralises absence dashboards, automates triggers, and supports mobile reporting, giving managers the visibility to intervene before patterns become crises. |
Table of Contents
- How big is the absence problem: key statistics and trends
- How absence reduces organisational productivity
- Presenteeism: the hidden productivity loss absence counts can miss
- Leading drivers of absence and how they show up in the data
- The absence multiplier: why one absent worker costs far more than their daily rate
- How accurate tracking and centralised reporting change what you can do
- Key absence metrics HR should track and why each matters
- How to move from reactive recording to proactive absence management
- How workforce-management systems support better absence tracking
- An HR leader’s perspective on absence visibility
- Timeprof gives you the visibility to act on absence data
- Sources
How big is the absence problem: key statistics and trends
The headline figure is striking enough on its own. 148.8 million working days lost in a single year, at an average of 5.7 days per employee. But the number that should concern HR leaders more is the direction of travel. The IPPR has documented a rising economic burden from sickness absence, with hidden costs up substantially since 2018. That trajectory matters because it means the problem compounds if left unmanaged.
5.7 days per employee per year is the UK average for sickness absence (ONS, 2022). If your organisation is above that, you have a measurable gap to close. If you are at or below it, you still need to know which roles and teams are pulling the average up.
The table below gives the most-cited benchmarks HR teams use to frame the problem internally.
| Metric | Figure | Source |
|---|---|---|
| Total working days lost (UK) | 148.8 million | ONS (2022) |
| Average days lost per employee | 5.7 days | ONS (2022) |
| Hidden cost trajectory | Rising since 2018 | IPPR |
| HSE classification | Persistent operational risk | HSE statistics overview |
Two trends are worth flagging beyond the raw numbers. Mental health conditions have grown as a proportion of long-term absence, and musculoskeletal disorders remain the dominant cause of short-to-medium-term absence in physically demanding roles. Both have distinct patterns in the data, which means a system that records only “sick day taken” is already losing information you need.
How absence reduces organisational productivity
The link between absence and lost output is not simply arithmetic. One person absent does not mean one person’s worth of work disappears cleanly. The disruption spreads.
The primary mechanisms:
- Capacity loss. The most obvious effect: fewer people doing the same volume of work, which either slows throughput or pushes remaining staff into overload.
- Disrupted handovers. In shift-based environments, an absent worker leaves gaps in knowledge transfer. The incoming shift starts behind, and errors or missed tasks follow.
- Overtime and cover costs. Unplanned absence triggers reactive cover decisions, often at premium rates. Automating overtime calculation reduces errors here, but the underlying cost is still real.
- Slower decision cycles. In project or knowledge-work settings, a key person’s absence stalls decisions that depend on their input. The team waits, or makes calls without full information.
- Manager time diverted. Every unplanned absence pulls a manager into reactive mode: finding cover, redistributing work, fielding calls. That time comes directly out of their capacity to lead, coach, and plan.
Consider a care home with a rota of 12 staff per shift. One unplanned absence at 6 AM means a manager spends 45 minutes on the phone before the shift starts, a colleague takes on additional residents, and the handover notes from the previous shift go unread. The ripple is immediate and measurable. HSE guidance frames this kind of disruption as a workplace risk, not just an HR inconvenience, which is why accurate records matter operationally as well as legally.
The morale dimension is often underestimated. When a team repeatedly absorbs the workload of absent colleagues without acknowledgement or structural support, engagement drops. That drop shows up later as its own absence spike.
Presenteeism: the hidden productivity loss absence counts can miss
Absence data tells you who was not there. It says nothing about the quality of output from those who were. Presenteeism, where employees attend work while unwell, is a significant and frequently invisible productivity drain.
A worker managing untreated anxiety, chronic pain, or early-stage burnout may be physically present but operating at a fraction of their cognitive capacity. Their error rate rises, their decision quality falls, and they are less likely to flag problems to a manager. None of that shows up in an absence report.
Tracking only recorded absence days systematically underestimates the true productivity cost of poor workforce health. The visible absence figure is the tip; presenteeism is the waterline below it.
The measurement blind spot is structural. Most absence systems capture a binary: present or absent. They do not capture quality of output, error rates, or the number of tasks completed per hour. That means an organisation can have a “good” absence rate and still be losing significant productive capacity to presenteeism.
Pro Tip: Look for patterns where absence frequency drops but performance metrics (output per shift, error rates, customer complaints) do not improve. That divergence is a signal that presenteeism may be filling the gap left by reduced recorded absence. Cross-referencing absence data with performance data is the diagnostic step most HR teams skip.
Leading drivers of absence and how they show up in the data
Knowing that absence is high is less useful than knowing why. The cause shapes the intervention, and different causes leave different fingerprints in absence records.
The main drivers and their data signatures:
- Mental health conditions (stress, anxiety, depression): tend to produce longer spells, higher recurrence, and a pattern of short absences before a longer episode. CIPD’s 2025 research documents mental health as a significant wellbeing concern identified by employees. The absence multiplier for mental health tends to be larger than for physical conditions, given the unpredictable recovery and team impact.
- Musculoskeletal disorders (MSK): common in care, logistics, retail, and manufacturing. Often produce medium-length absences (one to three weeks) with a risk of recurrence if the underlying cause is not addressed. Short repeated absences in physically demanding roles are a strong early signal.
- Respiratory and minor illness: high frequency, short duration, often seasonal. These are the easiest to plan around if you can see the seasonal pattern in your data.
- Long-term conditions: lower frequency but high cost per episode. Employees managing chronic conditions may have intermittent absence spread across the year, which a Bradford Factor score will flag even when individual spells look short.
A practical pattern to recognise: a team member who takes one or two days off every four to six weeks, always on a Monday or Friday, with varying stated reasons, is showing a pattern consistent with either a mental health issue or a workplace relationship problem. Neither resolves itself. A manager who can see that pattern in a dashboard has a conversation to have; a manager working from a paper register probably never notices it.
The business case for mental health benefits is directly tied to this: early intervention on mental health absence tends to shorten episodes and reduce recurrence, which is where the measurable ROI sits.

The absence multiplier: why one absent worker costs far more than their daily rate
The absence multiplier is the economic concept that explains why the direct cost of an absent employee, their salary for the day, is almost always an underestimate of the true cost. The Warwick research using a prevalence-cost framework shows that firms adopt workplace wellbeing practices in direct response to mental health-related absenteeism, and that larger, higher-productivity firms respond more strongly because their absence multiplier is larger.
The multiplier reflects various effects, including:
- Lost or delayed output from the absent worker.
- Additional workload on colleagues, which may lower their productivity.
- Manager time spent on reactive tasks instead of leadership.
- Premium costs from agency or overtime cover.
- Potential drops in service quality affecting customers or compliance.
A simple worked example. A team of eight processes 200 customer cases per day. One absence reduces capacity to seven, dropping throughput to roughly 175 cases. The backlog of 25 cases carries into the next day, where the team now has 225 to process. If the absence continues for three days, the backlog compounds. The manager has spent time on cover calls rather than quality checks. Two colleagues have worked through their breaks. The cost is not one day’s salary; it is three days of degraded service, two colleagues at elevated fatigue risk, and a manager who has not done their planned one-to-ones.
The multiplier is why measuring workforce management ROI requires going beyond salary costs, The real figure includes cover premiums, lost throughput, manager time, and the downstream morale effect on the team absorbing the extra load.
Firms that invest in tracking and wellbeing are, in economic terms, buying down the multiplier. That reframe tends to land better with finance teams than “we need better HR software.”
How accurate tracking and centralised reporting change what you can do
The practical difference between reactive and proactive absence management comes down to what you can see and when. Human Resources Magazine’s analysis makes the case directly: centralising absence reporting and using dedicated software reduces admin, improves visibility, and produces measurable ROI.

When absence data sits in spreadsheets, email threads, and managers’ notebooks, patterns are invisible until they become crises. When it is centralised and updated in real time, the same data becomes a set of early-warning signals.
Operational benefits of centralised, timely absence data:
- Pattern recognition. Repeated short-term absence by the same individual, or a spike in a particular team, becomes visible within days rather than months.
- Faster return-to-work management. Structured return-to-work conversations are easier to schedule and track when the system flags the return date automatically.
- Better cover decisions. Managers approving leave without visibility of upcoming capacity create coverage gaps. Real-time dashboards prevent approving too many absences during critical periods.
- Targeted wellbeing investment. If your data shows mental health absence concentrated in one department, you know where to direct an EAP referral or a manager training programme, rather than rolling out a generic initiative to everyone.
- Reduced admin time. Practitioner evidence suggests roughly 40% of HR admin time is spent on absence-related tasks. Centralised systems with automated triggers cut that materially.
Practitioner evidence suggests that modest reductions in average sickness absence per employee can lead to significant operational gains in medium-sized organisations.
The ROI case is not theoretical. It is built from admin hours saved, cover costs avoided, and throughput recovered. Workforce reports that link absence data to labour costs make that calculation visible to finance as well as HR.
Key absence metrics HR should track and why each matters
Tracking absence without a measurement framework produces data, not insight. The metrics below give HR teams a structured way to link absence records to productivity outcomes.
Essential metrics:
- Days lost per FTE: your primary benchmark against the ONS average of 5.7. Anything materially above that warrants investigation by team and role.
- Absence frequency (number of spells): distinguishes between one long illness and many short absences. High frequency with short duration is often a pattern signal, not a medical one.
- Average duration per spell: rising average duration suggests more serious underlying conditions and longer recovery trajectories.
- Bradford Factor score: weights frequent short absences more heavily than single long ones, making it useful for spotting pattern absence that a simple days-lost figure misses.
- Unplanned absence rate: the proportion of absences with less than 24 hours’ notice. High rates indicate scheduling and cover problems, not just health issues.
- Output per labour hour: connects absence data to actual productivity rather than just headcount. Requires operational data alongside HR records.
- Revenue per labour hour: the finance-facing version of the same metric, useful for board-level reporting.
The table below maps each metric to its operational trigger.
| Metric | Why it matters | Typical trigger action |
|---|---|---|
| Days lost per FTE | Benchmarks against national average | Investigate if materially above 5.7 days |
| Absence frequency | Reveals pattern absence | Return-to-work conversation; Bradford Factor review |
| Average spell duration | Signals severity of underlying conditions | Occupational health referral |
| Bradford Factor score | Weights repeated short absences | Formal absence review meeting |
| Unplanned absence rate | Exposes scheduling and cover risk | Cover protocol review; rota planning audit |
| Output per labour hour | Links absence to actual productivity loss | Operational review with line manager |
For a fuller view of the report types that support this framework, the range goes well beyond absence frequency alone.
How to move from reactive recording to proactive absence management
Most organisations record absence. Fewer manage it. The gap between those two positions is where productivity loss accumulates. The roadmap below is structured in three phases, with quick wins front-loaded.
Phase 1: Standardise (weeks 1–4)
- Agree a single absence reporting channel. Phone call to line manager, logged in one system, same day. No exceptions.
- Audit your current records for completeness. Missing reason codes and unclosed absence spells are common and distort every metric downstream.
- Define your Bradford Factor threshold for triggering a formal conversation. Many organisations use a score of 100 as the first review point.
- Confirm your statutory sick pay obligations are being met and that records are audit-ready. Accurate records are a legal requirement, not just an HR preference.
Phase 2: Centralise and analyse (weeks 5–12)
- Move absence data into a single platform with dashboard reporting. If you are still using spreadsheets, this is the highest-leverage change you can make.
- Set up automated alerts for repeated short-term absence (for example, three spells in 12 weeks).
- Run your first absence analysis by team, role, and reason code. Identify your top three absence drivers.
- Brief line managers on how to read the data and what a return-to-work conversation should cover.
Phase 3: Embed and improve (months 3–6)
- Link absence data to your wellbeing programme. If mental health is your top driver, direct EAP resource there first.
- Introduce occupational health referral triggers for absences exceeding a defined duration (commonly four weeks).
- Review your workforce management tools against the features this roadmap requires.
- Set a six-month target for days lost per FTE and report progress to the leadership team quarterly.
Pro Tip: Governance is what turns data into action. Assign one named person accountability for absence reporting at each level: team manager, HR business partner, and senior leader. Without a named owner, dashboards get reviewed and nothing changes. The data is only as useful as the conversation it prompts.
How workforce-management systems support better absence tracking
Technology does not solve absence problems. It removes the friction that stops managers from seeing and acting on them early enough. The features that matter are specific.
Feature checklist and productivity benefit:
- Centralised absence dashboard: gives HR and senior managers a real-time view across all sites and teams, without chasing individual managers for updates.
- Automated absence triggers: flags repeated short-term absence without requiring a manager to count spells manually. The system does the pattern recognition; the manager has the conversation.
- Audit-ready records: every absence entry is timestamped and attributed, which matters for statutory sick pay compliance and any employment tribunal defence.
- Mobile reporting: frontline managers in care, security, and hospitality rarely sit at a desk. A mobile-first system means absence is logged at the point it happens, not reconstructed at the end of the week.
- Geofenced clock-in: confirms attendance at the right location at the right time, reducing the gap between scheduled and actual hours worked.
- Shift cover tools: when absence is logged, the system can surface available, qualified staff immediately, reducing the time a manager spends on reactive cover calls.
- Leave visibility across sites: managers approving annual leave without seeing overall capacity create the coverage gaps that turn into unplanned absence crises. Multi-site dashboards prevent that. Reducing scheduling errors starts with visibility.
An illustrative scenario. A security firm with 80 staff across six sites previously managed absence through a combination of phone calls, a shared spreadsheet, and a WhatsApp group. Managers spent an estimated two to three hours per week on absence administration. After moving to a centralised platform with automated triggers and mobile reporting, the same managers reported spending under 30 minutes on the same tasks, with absence patterns visible in a dashboard rather than discovered in a conversation. The operational gain was not just time saved; it was earlier intervention on a pattern of Monday absences in one team that had been invisible in the spreadsheet.
Human Resources Magazine’s ROI analysis finds that centralising reporting converts absence records into early intervention tools. The shift from recording to managing is a platform capability question as much as a policy one.
Concrete metrics to track after implementation: reduction in manager hours spent on absence admin per week, reduction in unplanned shift gaps per month, and change in days lost per FTE at the six-month mark.
An HR leader’s perspective on absence visibility
The conversation about absence management in most organisations is still framed around compliance: are we recording it correctly, are we paying SSP accurately, are we keeping the right records? Those things matter, and GOV.UK’s guidance on statutory sick pay is clear on what employers must do. But compliance is the floor, not the ceiling.
What I see consistently is that organisations invest in absence tracking and then underinvest in the capability to act on what the data shows. A dashboard that flags a pattern is only useful if the manager receiving that flag knows what to do with it. Return-to-work conversations done well are one of the most effective early-intervention tools available. Done badly, or not at all, they are a missed opportunity every single time.
The cultural shift that matters most is moving managers from seeing absence as an HR problem to seeing it as a team performance signal they own. That shift does not come from software alone. It comes from training, from clear escalation paths, and from leaders who model the behaviour by asking about absence data in their own team reviews.

The Warwick prevalence-cost research is useful here because it frames wellbeing investment as a rational economic response to the absence multiplier, not a soft HR initiative. That framing gives HR leaders a language that works in a board conversation. Use it.
Measure the right things. Act on what you find. And make sure the people closest to the absence, the line managers, have both the data and the confidence to respond early.
Timeprof gives you the visibility to act on absence data
Absence management only delivers results when the data is visible, timely, and connected to the people who need to act on it. Timeprof brings together centralised absence dashboards, audit-ready records, mobile reporting, and geofenced clock-in into one platform, so managers have a single source of truth rather than a patchwork of spreadsheets and phone calls.
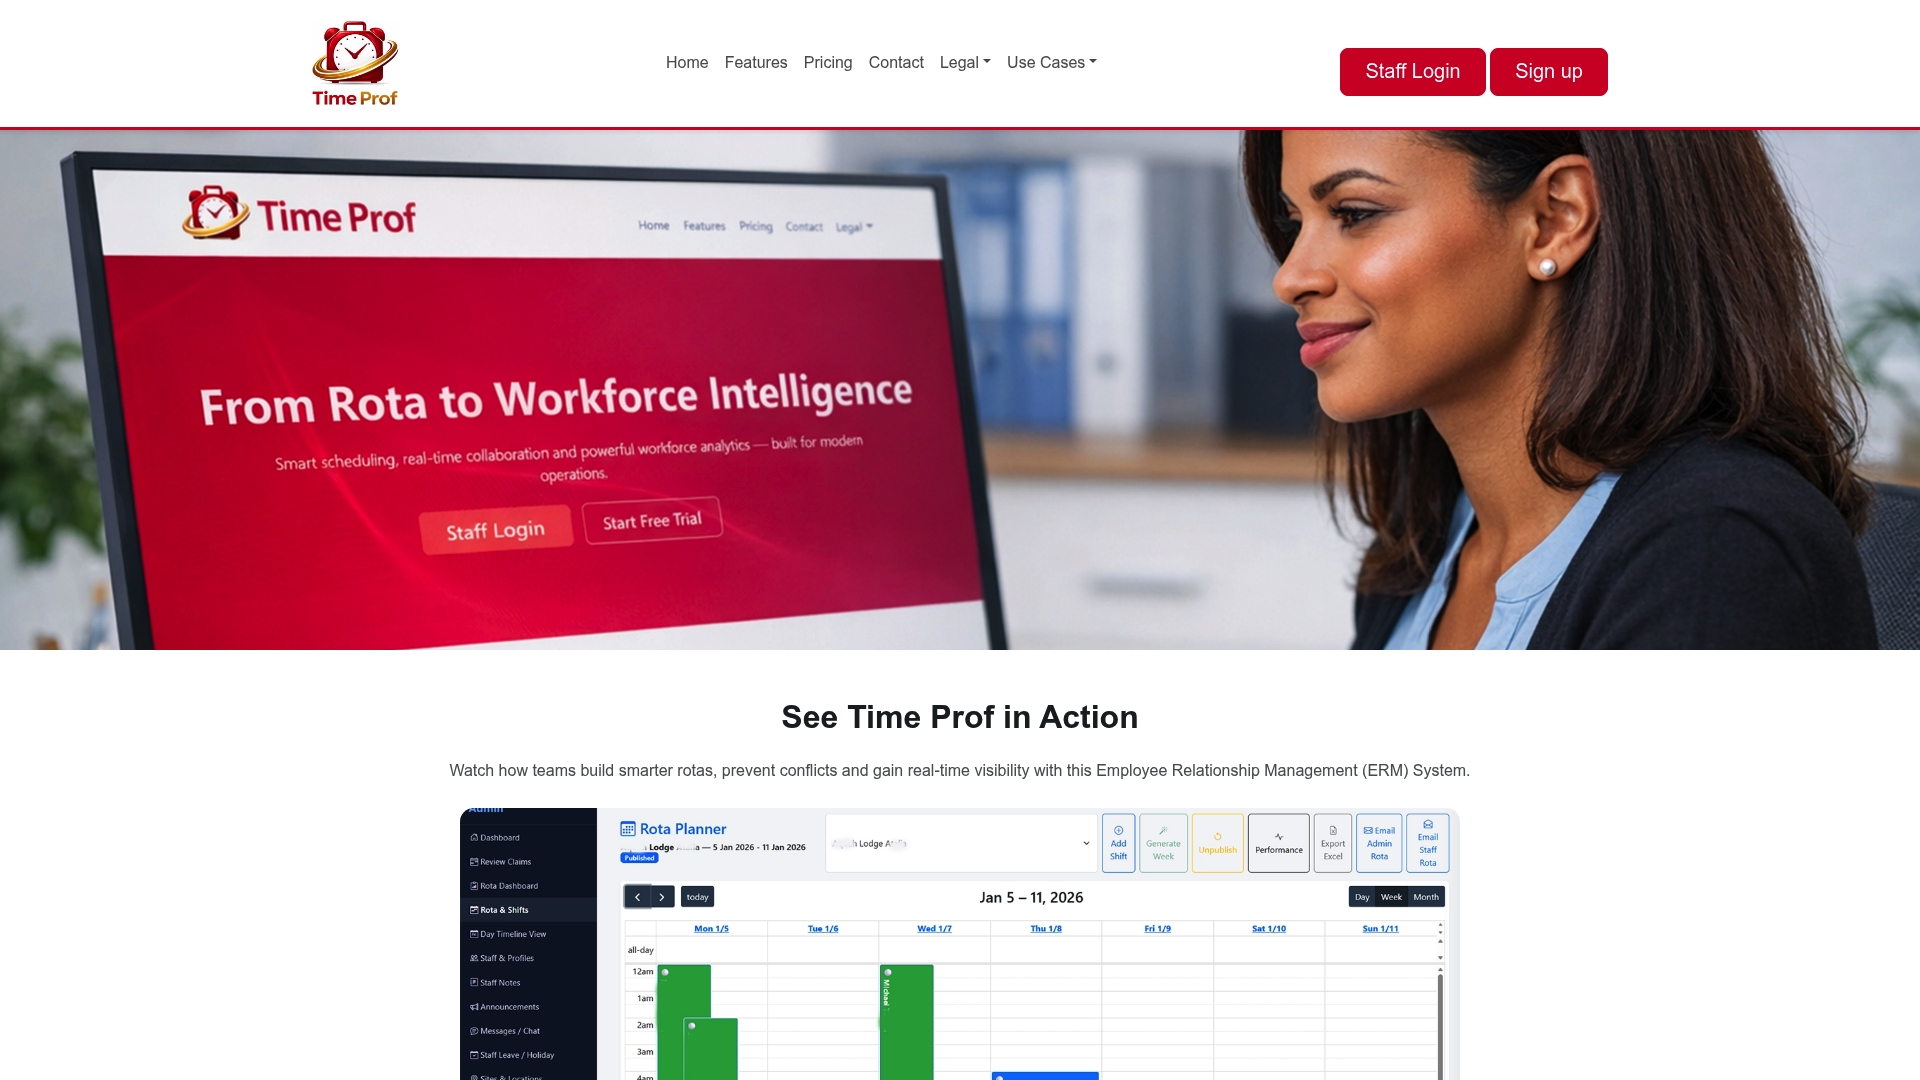
For HR leaders working through the roadmap above, Timeprof directly supports the steps that matter most:
- Save manager time: automated absence triggers and mobile logging cut the admin burden that currently consumes hours per week.
- Reduce scheduling errors: real-time leave visibility across sites prevents coverage gaps before they become unplanned absence crises.
- Improve absence visibility: live dashboards surface patterns, from repeated short-term absence to seasonal spikes, without waiting for a monthly report.
If you are ready to move from reactive recording to proactive management, explore Timeprof’s workforce platform or book a demo to see how the features map to your organisation’s specific absence challenges.
Sources
The sources below are the principal references used in this article. Each is worth reading in full for the data and guidance it contains.
- ONS — Sickness absence in the labour market (2022)
- HSE — Statistics overview
- Gov
- Absenteeism, productivity and workplace well‑being: a prevalence–cost approach (Warwick wrap)
- CIPD — Health and wellbeing at work: Views of employees (2025)