How to measure workforce management ROI effectively
Learn how to measure workforce management ROI effectively. Discover key metrics to justify investments and boost operational efficiency.

Workforce management ROI is the financial and operational return gained from investing in systems, processes, and technology that govern how staff are scheduled, tracked, and managed. Executives who measure workforce management ROI accurately can justify technology spend, reduce labour waste, and build a repeatable case for further investment. Organisations implementing workforce management solutions typically achieve 200–700% first-year returns, with payback arriving within 30 to 120 days. That range is wide because the return depends entirely on what you measure, how you measure it, and whether you include every cost and benefit in the calculation.
What metrics do you need to measure workforce management ROI?
The right workforce management metrics form the foundation of any credible ROI calculation. Without them, you are comparing costs against guesswork rather than against real operational data.
The six metrics that matter most are turnover cost, overtime spend, schedule adherence, labour cost variance, time-to-fill open positions, and manager scheduling time. Each one captures a distinct financial pressure. Turnover cost, for example, is frequently underestimated. Replacing a single hourly employee costs around £4,600, and that figure excludes lost productivity during the vacancy period.

Baseline measurement is non-negotiable before any change is made. Record your current state across all six metrics for at least one full scheduling cycle, ideally three months. That baseline becomes the denominator in every ROI calculation you run later.
| Metric | Definition | How to measure it |
|---|---|---|
| Turnover cost | Total cost to replace one departing employee | Recruitment, onboarding, and lost productivity costs per leaver |
| Overtime spend | Labour cost above contracted hours | Payroll data filtered by overtime codes |
| Schedule adherence | Percentage of shifts filled as planned | Planned vs. actual shifts completed each week |
| Labour cost variance | Difference between budgeted and actual labour spend | Finance system actuals vs. approved rota budget |
| Time-to-fill | Days from vacancy opening to confirmed hire | HR system date stamps |
| Manager scheduling time | Hours per week spent building and adjusting rotas | Time-tracking or manager self-report |
Indirect costs deserve equal attention. Absenteeism, compliance penalties, and the administrative burden of manual rota corrections all carry real financial weight. Businesses upgrading from manual systems can expect 15–25% improvements in turnover, time-to-fill, and labour cost variance within the first year. That improvement range gives you a realistic target when setting ROI expectations with your finance team.
Pro Tip: Pull baseline data from your existing HR and payroll systems before buying any new tool. Clean, internal data produces a far more credible business case than industry averages.
How do you calculate workforce management ROI accurately?
The standard ROI formula is straightforward: subtract total investment from total benefits, divide by total investment, and multiply by one hundred to get a percentage. The difficulty lies in defining what counts as a benefit and what counts as a cost.
Total investment must include software licensing, implementation fees, staff training time, internal project management hours, and any consulting support. A credible ROI model explicitly captures all of these, not just the headline software price. Executives who present a business case built only on licence cost routinely face scepticism from CFOs who know the hidden costs exist.
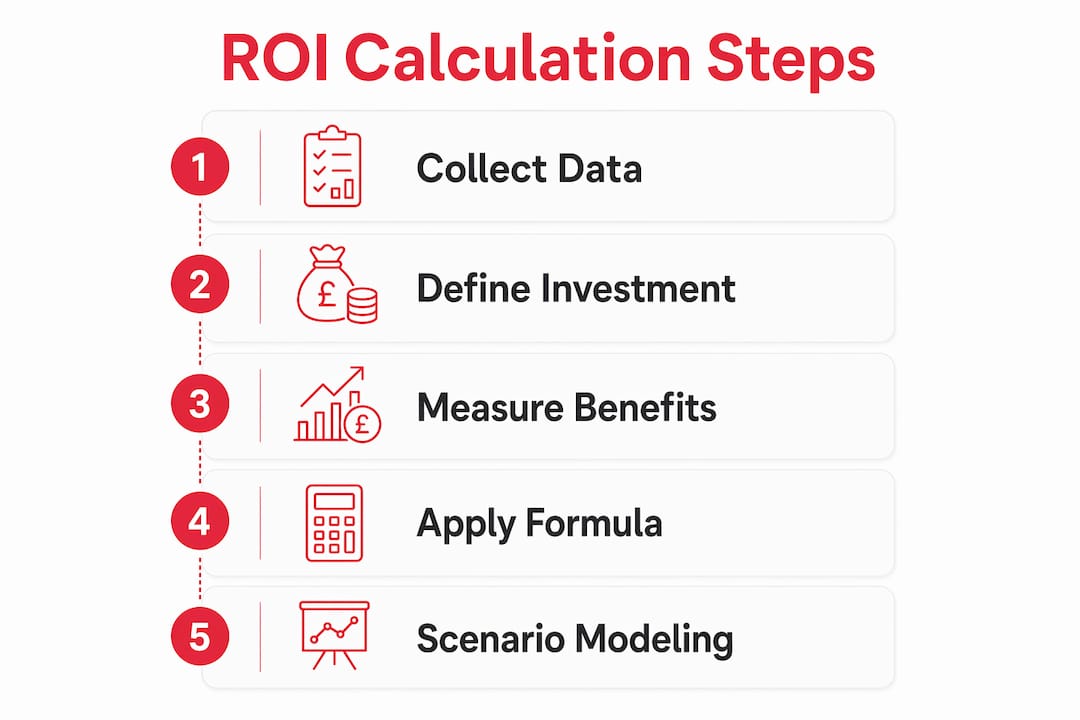
On the benefit side, the most significant line items are turnover cost avoidance, overtime reduction, and manager time recovery. Reducing manual scheduling time by 80% saves enough management labour to repay software investment within 30 to 90 days. That is often the fastest payback lever available, yet it is the one most frequently left out of initial calculations.
Scenario modelling turns a static ROI calculation into a genuine planning tool. ROI models used as scenario tools can stress-test assumptions around attrition rate changes, extended vacancies, or compensation drift, revealing hidden cost leakage like overstaffing drag. Run at least three scenarios: conservative, base case, and optimistic. Present all three to leadership so the range of outcomes is transparent.
A practical example illustrates the point. A care organisation with 200 staff, spending 15 manager hours per week on scheduling at an average cost of £25 per hour, spends roughly £19,500 per year on scheduling labour alone. A platform that cuts that by 80% recovers £15,600 annually from one metric. Add turnover cost avoidance of even five fewer leavers per year at £4,600 each, and the annual benefit reaches £38,600 before overtime savings are counted.
Pro Tip: Never use abstract industry averages as your benefit figures. Use your own payroll, HR, and finance data. Internal numbers produce a business case that survives scrutiny; averages do not.
What tools support workforce management ROI measurement?
The right technology does two things simultaneously: it generates the operational data you need and it makes that data visible to the people who need to act on it.
Workforce analytics platforms track schedule adherence, flag overtime trends, and surface labour cost variance in near real time. That matters because tracking lagging outcomes alone is insufficient. Leading indicators, such as near-real-time schedule adherence and volume drift warnings, allow managers to intervene before a problem becomes a cost.
ROI calculators built around your internal data are more useful than generic online tools. The best ones let you input your own turnover rate, average replacement cost, manager hourly rate, and overtime spend, then model the impact of specific percentage improvements. That specificity is what makes a business case credible to a CFO or CHRO.
When evaluating workforce management technology for ROI measurement, look for these capabilities:
- Real-time attendance tracking with geofenced clock-in to confirm shift coverage as it happens
- Live multi-site dashboards that aggregate schedule adherence and labour cost data across locations
- Automated reporting that delivers weekly or monthly summaries to senior leadership without manual compilation
- Audit-ready compliance records that reduce the risk of regulatory penalties
- Shift-linked task tracking to measure operational output alongside labour cost
- Integration with payroll and HR systems to eliminate manual data reconciliation
Timeprof combines all of these capabilities in a single platform. Its live dashboards give managers a real-time view of attendance, shift coverage, and labour cost across every site, which means the data needed for ROI reporting is always current and always accessible.
Pro Tip: Integrate your workforce management platform with your existing payroll and finance systems from day one. Manual data exports create reconciliation errors that undermine the credibility of your ROI reports.
Common mistakes in measuring workforce management ROI
The most damaging mistake is measuring only what is easy to measure. Software cost and overtime spend are visible in every finance system. Turnover cost avoidance, manager time recovery, and compliance risk reduction are harder to quantify, so they get left out. The result is an ROI figure that understates the true return and fails to secure ongoing executive support.
Avoid these specific errors:
- Using industry averages instead of internal data. Measuring ROI with internal data produces a more reliable business case and stronger executive buy-in than benchmarks from unrelated organisations.
- Ignoring leading indicators. Measuring only end-of-month outcomes means problems are already costly by the time they appear in a report.
- Excluding total cost of investment. Implementation, training, and internal project time are real costs. Omitting them makes the ROI look better than it is and damages credibility when the full picture emerges.
- Treating the ROI model as a one-time exercise. Workforce dynamics change. A model built in january becomes inaccurate by june if attrition rates or wage costs shift.
- Undervaluing turnover cost avoidance. Focusing on cost avoidance backed by measurable metrics can double typical ROI projections. Most organisations count only direct savings.
The correction for all of these errors is the same: build a living ROI dashboard that updates monthly with real operational data. That dashboard becomes the evidence base for every budget conversation about workforce management investment.
Pro Tip: Build your ROI dashboard before you need it for a budget review. A dashboard that has been running for three months carries far more weight than a spreadsheet assembled the week before a board meeting.
How to implement an ROI measurement process in your organisation
A structured process produces consistent, defensible results. Follow these steps in order.
- Define clear objectives. Decide which business problems the workforce management investment is solving. Reducing overtime? Cutting turnover? Recovering manager time? Objectives determine which metrics matter.
- Establish baseline metrics. Capture current performance across all relevant metrics for a minimum of three months before any system change.
- Select your measurement tools. Choose a workforce management platform that generates the data your ROI model requires, and confirm it integrates with your payroll and HR systems.
- Gather cross-functional input. HR, finance, and operations each hold data that the others need. Assign a named owner in each function to supply their data on a fixed schedule.
- Calculate ROI using internal data. Apply the standard formula using your baseline figures and your actual investment costs. Run conservative, base, and optimistic scenarios.
- Report results to senior leadership. Present findings through a live dashboard, not a static slide deck. Update it monthly so leadership can see progress in real time.
- Refine the model quarterly. Review assumptions, update cost figures, and add new benefit categories as they become measurable.
Engaging stakeholders early prevents the most common implementation failure: an ROI model that finance does not trust because they were not involved in building it. A cross-functional working group that includes HR, finance, and operations produces a model that all three functions will defend.
Pro Tip: Document every assumption in your ROI model and share that documentation with all stakeholders. Transparent assumptions build trust. Unexplained numbers invite challenge.
Key takeaways
Measuring workforce management ROI accurately requires internal data, a total-cost investment view, and a living model that updates as workforce conditions change.
| Point | Details |
|---|---|
| Establish a baseline first | Capture at least three months of operational data before implementing any change. |
| Include all investment costs | Licensing, training, implementation, and internal time must all appear in the cost column. |
| Quantify turnover cost avoidance | Replacing one hourly employee costs around £4,600; even small reductions in turnover produce significant returns. |
| Use scenario modelling | Run conservative, base, and optimistic scenarios to give leadership a transparent range of outcomes. |
| Build a living dashboard | Update your ROI model monthly with real data so it remains credible for every budget conversation. |
Why most ROI models fail before they start
The pattern I see most often is executives who build an ROI model once, present it to the board, and then never update it. Six months later, the model is out of date, the assumptions are wrong, and nobody trusts the numbers. The investment gets questioned even when it is clearly working.
The shift that changes everything is treating ROI measurement as an operational discipline rather than a one-time finance exercise. Real-time workforce analytics enable a shift from reactive to proactive management, and the same principle applies to ROI measurement itself. When your dashboard updates monthly with live data, you stop defending past decisions and start using the model to make better future ones.
Scenario modelling is the other capability most organisations skip. Scenario-based ROI models can forecast the financial impact of attrition rate changes, extended vacancies, and compensation drift. That turns your ROI model into a risk management tool, not just a justification document. CFOs respond very differently to a model that shows what happens under three different attrition scenarios than to one that presents a single optimistic number.
The organisations that get this right share one habit: they assign a named owner to the ROI model and give that person the authority to pull data from HR, finance, and operations every month. Without that ownership, the model drifts.
— Michael
Timeprof gives you the data your ROI model needs
Accurate ROI measurement depends on accurate operational data, and that data has to be current. Timeprof delivers real-time workforce intelligence across scheduling, attendance, shift coverage, and labour cost, giving managers the live visibility they need to populate an ROI model with confidence rather than estimates.
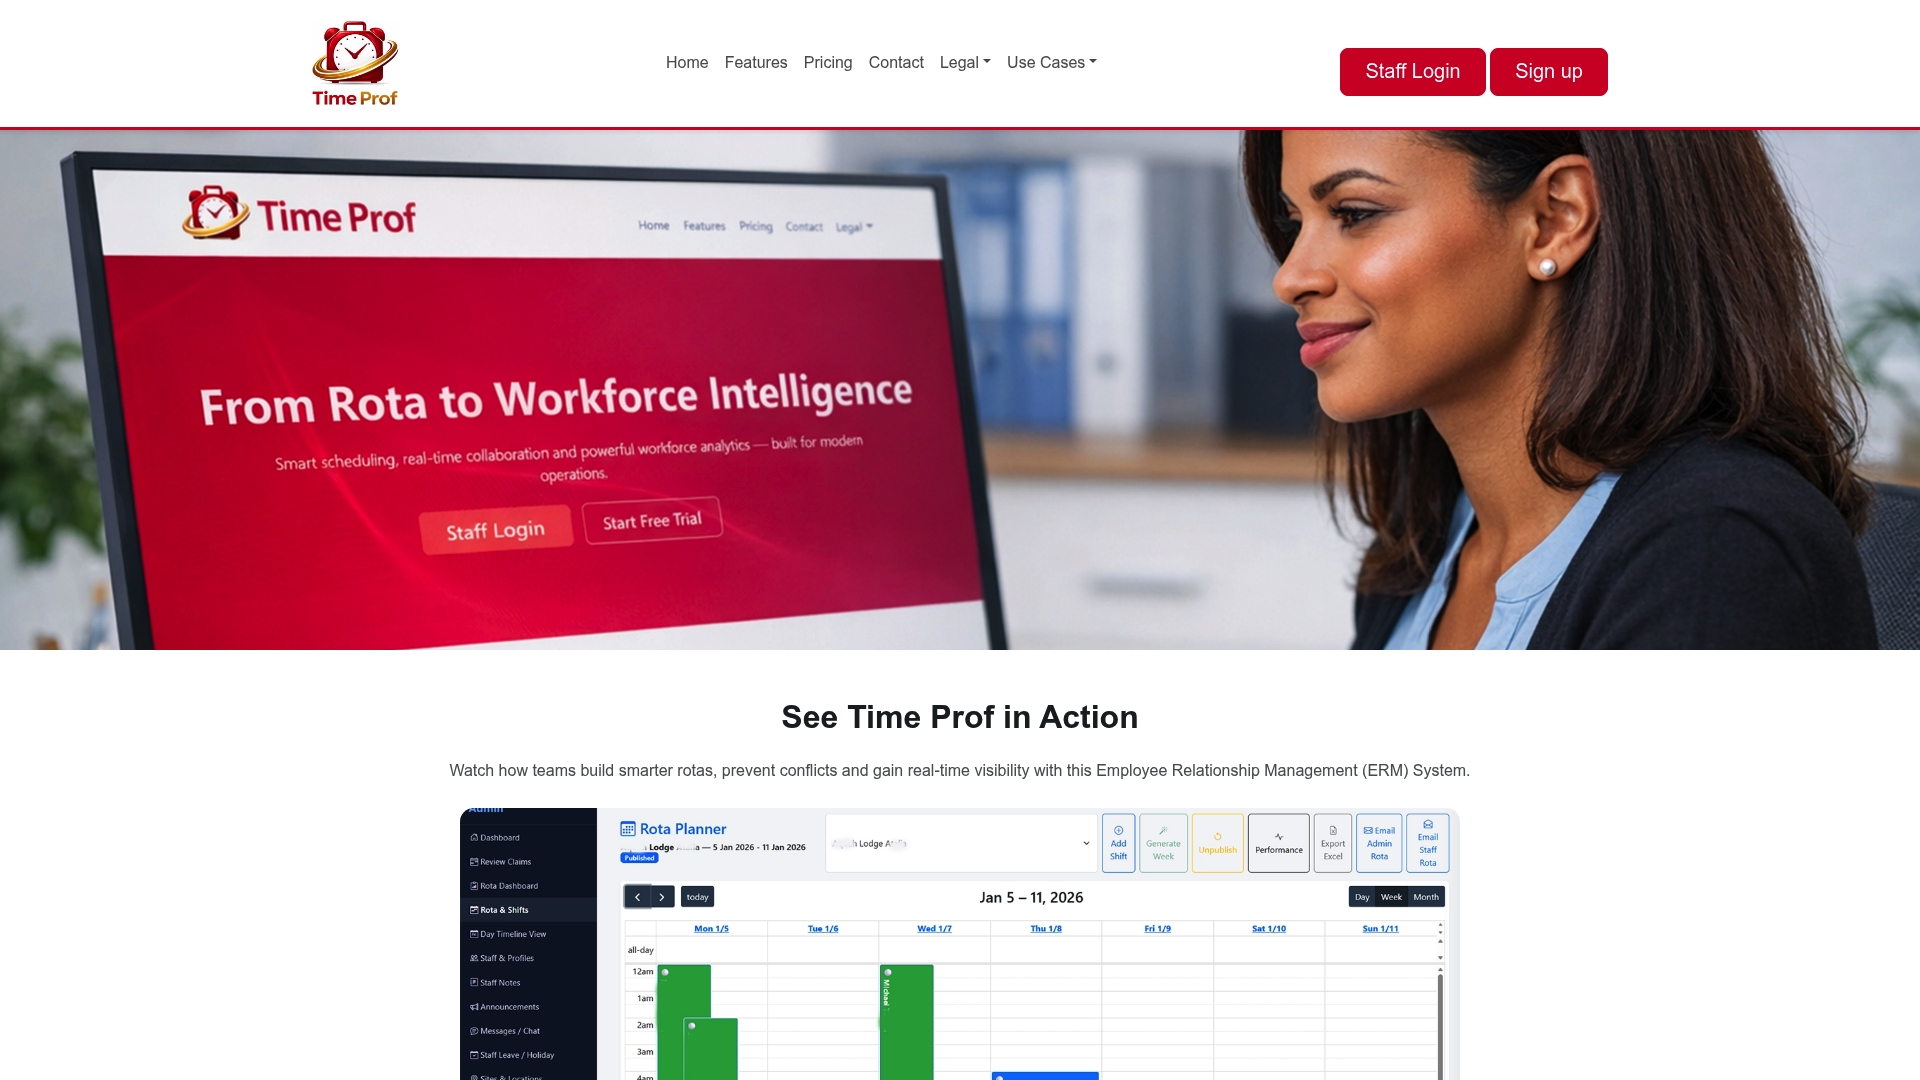
The platform’s live multi-site dashboards, geofenced clock-in, and automated operational reports mean the metrics that matter most to your ROI calculation are always up to date and always accessible. Finance teams get the numbers they trust. Operations teams get the visibility they need. And executives get a business case that holds up under scrutiny. Timeprof brings rota planning, attendance tracking, and workforce reporting together in one place, so your ROI measurement process runs on real data, not spreadsheet approximations.
FAQ
What is workforce management ROI?
Workforce management ROI is the financial return generated by investing in systems and processes that govern scheduling, attendance, and labour cost control. It is calculated by dividing net benefits by total investment costs and expressing the result as a percentage.
What ROI can organisations realistically expect?
Organisations implementing workforce management solutions typically achieve 200–700% first-year ROI, with payback periods of 30 to 120 days. The actual return depends on baseline inefficiency levels and how comprehensively benefits are measured.
Which metric is most often overlooked in ROI calculations?
Manager time recovery is the most frequently overlooked ROI driver. Reducing scheduling effort by 80% can repay software investment within three months, yet most organisations exclude it from their initial business case.
How often should an ROI model be updated?
An ROI model should be updated at least quarterly, and ideally monthly. Workforce costs, attrition rates, and operational conditions change continuously, and a static model quickly loses credibility with finance and senior leadership.
Should I use industry benchmarks or internal data for ROI calculations?
Internal data always produces a more credible business case. Using internal company data rather than broad industry averages gives executives and finance teams a calculation they can verify and defend.